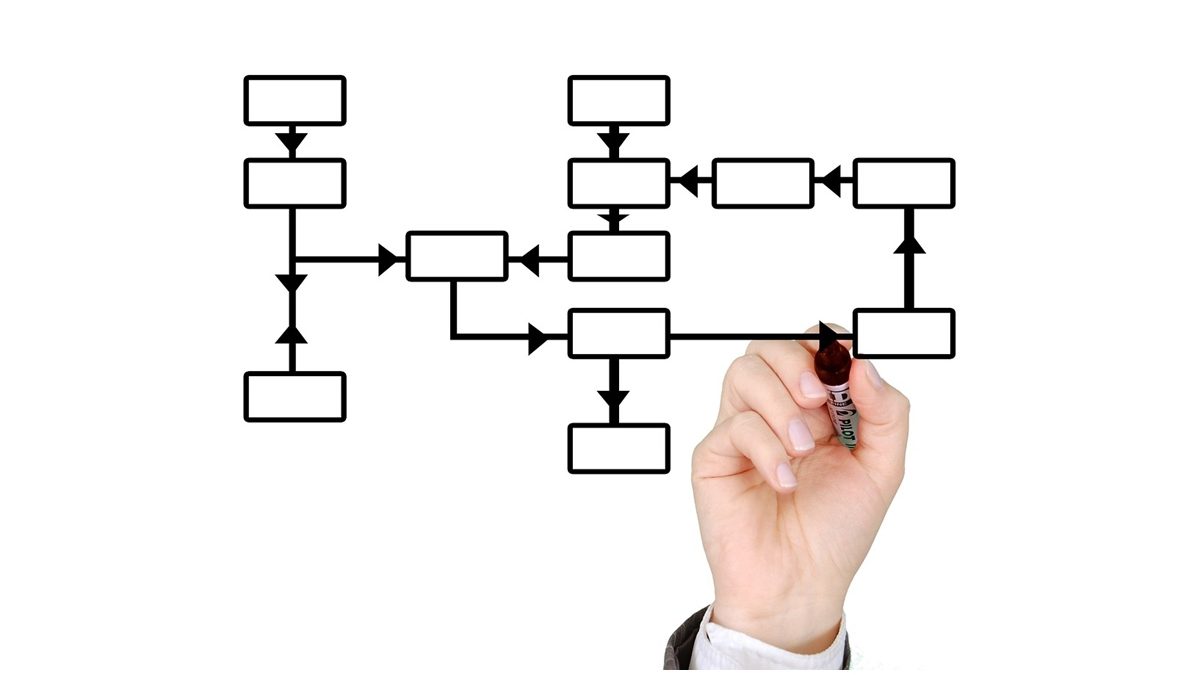
A flow chart is a visual representation of the sequence of steps in a process. Creating detailed flow charts using flowchart templates can help improve process efficiency by identifying bottlenecks, redundancies, and opportunities for streamlining. This allows organizations to optimize workflows, reduce costs, and boost productivity.
Table of Contents
Creating Detailed Flow Charts
The first step is to identify the process you want to map out. Gather information by observing the process in action, interviewing employees who perform the tasks, and gathering data on cycle times. Then break down the process into discrete steps from start to finish.
When creating the flow chart, use standard flow chart symbols like ovals for start/end points, rectangles for tasks, diamonds for decisions, and arrows to connect the elements. Capture every action and decision point in granular detail. Note the person or department responsible, inputs, and outputs for each step.
Once the initial draft is complete, validate the flow chart with employees to fill in any missing details. The end result should be a visual map of every step and sequential flow of the process.
Identifying Inefficiencies
With a detailed flow chart, inefficiencies and waste become easier to spot. Look for the following indicators of inefficiency:
- Redundant steps – Areas where the same task is performed multiple times for no added value.
- Bottlenecks – Points where work piles up due to bandwidth constraints. This causes delays and queued up work.
- Loops and backtracking – Situations where work cycles back unnecessarily vs flowing linearly.
- Excess motion – Movement of people, information, or equipment that does not add value.
- Overprocessing – Doing more work than is required for the desired output.
The flow chart helps quantify waste. Steps that do not contribute to meeting customer requirements are candidates for elimination or process redesign.
Improving Process Flow
Once the pain points are visible, you can streamline the workflow. Some approaches include:
- Eliminate redundant steps
- Automate manual tasks
- Re-sequence steps for better flow
- Combine steps done separately by different departments
- Remove bottlenecks and reallocate resources
- Simplify processes and eliminate overprocessing
The redesigned process flow should reduce cycle time and waste while still meeting quality standards. Update flow charts with changes to document the new standard procedures.
Benefits of Flow Charting
Detailed flow charts bring several advantages for driving process excellence:
- Visual mapping of end-to-end process flow
- Identification of non-value-add activities
- Objective view of pain points requiring improvement
- Documentation of standard procedures
- Training tool for new employees
- Framework for process analysis and audits
Flow charting enables fact-based process optimization rather than guesswork. The result is enhanced efficiency, lower costs, reduced errors, and more consistent output quality.
To get the most out of flow charting, engage a cross-functional team in mapping processes. Different perspectives often reveal steps that certain departments are blind to. Perform process walks to validate the flow in real time. Use flow chart data to calculate metrics like cycle times, resource utilization, and cost per transaction. This quantified view allows you to make data-driven decisions on process redesign.

